
Mechanisms and worked studies
A canonical risk app baseline
Expected loss requires defined probabilities and units
Expected loss is an average over a defined uncertain event mechanism. It is not the payment that will necessarily occur next year, a maximum exposure or a reserve requirement. In the simplest event representation, the probability of the event multiplies the loss if it occurs. The meaning of that product depends entirely on the event and the units. An annual event probability paired with a contribution loss for that event can produce an annual expected contribution loss. A monthly frequency paired with a multiyear loss cannot produce the same object without a declared transformation.
The canonical demonstrator uses an annual probability of the stated gross event. It treats that probability as a chance of occurrence within the annual representation, not as an expected count in a repeated-event process. The severity is the supplied loss conditional on the relevant event state. If several damaging occurrences can take place during the year, a count model and an appropriate consequence aggregation may be needed. The demonstrator does not infer that count model from a large annual probability, and it cannot represent every recurrence mechanism by increasing a probability beyond its valid range.
Base dispatch inputs and incidence
Explicitly illustrative annual event representation; money is USD thousand and prevention and mitigation apply only when shared support is available.
Scroll for all columns. With the table focused, use the left and right arrow keys.
| Base dispatch inputs and incidence | ||
|---|---|---|
| Field | Frozen value | Interpretation |
| Gross annual event probability | 20.00% | Chance of the stated annual event, not an event count |
| Gross event consequence | 1,000.00 | One distinct contribution-loss claim |
| Conditional prevention | 80.00% | Event-probability reduction in available state |
| Conditional mitigation | 50.00% | Severity reduction in available state |
| Shared support availability | 60.00% | Common operating-state weight |
| Annual control cost | 30.00 | Recurring resource cost, separate from event severity |
The monetary loss should identify whose consequence is being measured. Lost contribution, repair expenditure, customer claims and broader economic loss are different objects. Some can coexist, while others contain or offset one another. A register that adds a lost revenue figure to a contribution loss for the same service interruption may count the same harm inconsistently. A severity estimate should therefore show its incidence, boundary and exclusions before it enters a probability calculation. Correct multiplication cannot repair a loss definition that already contains duplication.
Evidence and scope
The World Bank PPP guidance identifies financial and regulatory risk categories. It does not calibrate this illustration.
Evidence: Identifying Risks
Control cost has a different role. It is a recurring resource requirement supplied for the intervention, not a probability-weighted event severity. The model subtracts that annual cost from avoided annual expected loss to produce net annual control value. This is a screening measure under the declared mechanism. It is not a project return, a discounted investment value or proof that implementation is affordable at the required time. A proposal with attractive annual value may still require an unavailable initial commitment or may compete with more valuable alternatives outside this paper's scope.
Gross expected loss is the reference result under the supplied gross event probability and severity. It is not necessarily a description of the organisation before any existing controls. A fixture can use a deliberately defined no-supplied-control counterfactual, but an actual appraisal must explain which protections are already reflected in the probability and severity. Crediting a new control against a baseline that already contains its effect would overstate the benefit. Conversely, removing all existing protections can exaggerate a counterfactual that the organisation would never allow. Baseline definition is a substantive part of the decision.
In the shared-control mechanism, annual residual expectation is formed by weighting the unavailable and available operating states. The unavailable state retains the gross event probability and severity. The available state applies the conditional prevention and mitigation effects. The state weights describe the stipulated availability of common operating support. This arrangement deliberately preserves the dependency between the control functions. It produces an expectation across states, while making each state's event probability and severity inspectable. The annual average can be reconciled to those state contributions rather than presented as a mysterious residual rating.
Exact state mixture in the base case
These are canonical model outputs. State probabilities and event probabilities are different conditional objects; weighted loss is USD thousand per year.
Scroll for all columns. With the table focused, use the left and right arrow keys.
| Exact state mixture in the base case | ||||
|---|---|---|---|---|
| State | State weight | Event chance in state | Event severity | Weighted loss |
| Unavailable | 40.00% | 20.00% | 1,000.00 | 80.00 |
| Available | 60.00% | 4.00% | 500.00 | 12.00 |
The weighted-loss rows reconcile to residual annual expected loss of USD 92.00 thousand. The residual annual event probability is 10.40%, while the event-conditional severity is USD 884.62 thousand. These are outputs of the stated mixture. The relatively high conditional severity reflects the weight of events occurring when shared protection is unavailable. A reader who reported only the available-state severity would omit that consequence of the mechanism.
Illustrative. The base gross expectation is USD 200.00 thousand per year. Avoided expectation is USD 108.00 thousand, and annual control cost is USD 30.00 thousand, yielding net annual control value of USD 78.00 thousand. The optional economic condition is therefore satisfied under the stipulated inputs. The completed governance record still holds implementation because operating evidence, delivery access and actual delegation are unresolved. The arithmetic result and the held act are compatible statements about different conditions.
A reader should inspect both the event probability and the event-conditional severity after the mixture. Prevention makes some events less likely, while mitigation reduces losses only in the state where it operates. The remaining events can be disproportionately associated with the unavailable state. As a result, an event-conditional residual severity is not obtained merely by applying the mitigation percentage to the gross severity. The denominator is the residual probability of an event across the states. Ignoring that conditioning can give an attractive severity figure that describes only the controlled state, not the events that remain in the model.
A probability is a dimensionless fraction even when the interface displays a percentage. The fixture stores some probability inputs in percentage units, whereas the computed residual probability is a fraction. The manuscript binds each value with the appropriate display convention. This distinction prevents a familiar arithmetic error: multiplying a percentage number as though it were already a fraction, or converting a fraction twice. A numerical ledger should record units at the field level, because the same word probability can appear in different representations across inputs, tables and charts.
The model's conditional average severity is meaningful only when the residual event probability is positive. If the supplied mechanism removes that probability entirely, a conditional severity has no event population over which to average. An undefined conditional quantity should remain undefined. Replacing it with zero would suggest an observed or meaningful severity of events that do not occur under the model. The appropriate decision question then moves to whether the claimed complete prevention is supportable and whether other event paths remain outside the representation.
Residual expectation and recurring resources are separate objects
The canonical sweep changes only the hypothetical shared availability and retains the base event, conditional effects and annual cost. The second series includes the fixed recurring resource cost.
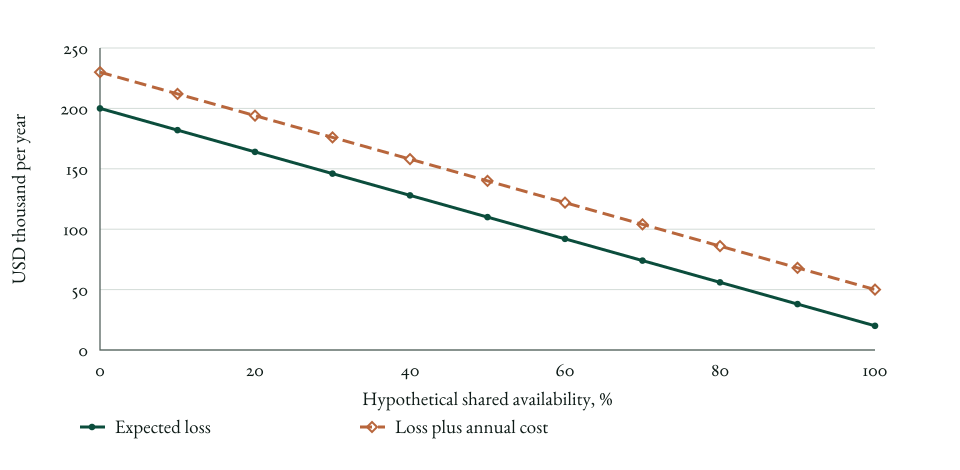
Original deterministic drawing of canonical sweep outputs. Markers are supplied discrete tests, joined for reading. Availability is hypothetical rather than measured; no probability distribution or implementation optimisation is inferred.
Sensitivity can distinguish arithmetic fragility from evidence weakness. A modest change in an uncertain input may reverse an optional economic condition, in which case the input deserves attention. An output can also be numerically stable over declared scenarios while the mechanism omits a decisive consequence. Both problems matter, but they require different repairs. More decimal places address neither. The worked examples use disclosed changes to show what follows from the supplied engine, while the governance record retains conditions that the engine does not calculate.
Completed unit and incidence challenge
The fictional analyst has resolved the mathematical representation but has not validated actual parameter estimates.
Scroll for all columns. With the table focused, use the left and right arrow keys.
| Completed unit and incidence challenge | ||
|---|---|---|
| Challenge | Recorded answer | Disposition |
| Annual chance or repeated count? | Annual event chance stipulated | Count-process inference excluded |
| Probability representation? | Percentage input; fraction output | Field-level formatting checked |
| Who bears the event loss? | Fictional contribution-loss claim | Do not add revenue for the same harm |
| What does cost represent? | Annual control resources | No initial investment return inferred |
| What baseline is used? | Gross event without supplied control effects | Actual baseline remains to be justified |
| Can a mean authorise acceptance? | Optional arithmetic condition only | Implementation and consequence conditions separate |
An expectation can support comparison without settling appetite. In the base dispatch case, the model supplies a positive avoided-loss benefit after control cost. The rare-major-consequence case has the same annual expected-loss arithmetic with a substantially different event consequence. A decision maker may legitimately apply a distinct consequence condition, provided its authority and purpose are stated. The expectation is not wrong because that additional condition matters. It is insufficient for that particular acceptance question. Confusing mathematical validity with decision completeness creates avoidable disputes about whether the model should be trusted.
Define the object before multiplying
Accept an expected-loss calculation for its stated comparison only after the event, exposure period, loss incidence and control-cost basis are coherent.
- Identify chance, count and conditional severity separately.
- Reconcile state contributions to the annual expectation.
- Keep annual control value distinct from financing, investment and appetite conclusions.
A useful expectation ledger should allow a reviewer to reconstruct the path from the declared inputs to the outputs and then identify the question the result can answer. The model files preserve complete input, output and scalar bindings. The publication tables select the values needed for the argument. Selection should not hide an adverse field, a warning or a state definition. The reader who wants to reproduce the case should be able to recover the full object rather than reverse-engineer rounded printed values. Display rounding is for reading; the frozen values remain the calculation basis.
Expected loss may be a sufficient screening measure
For many comparable and reversible controls, an annual expectation can rank investigation priorities efficiently. Additional tail analysis is needed when a consequence condition or nonlinearity changes the decision, not merely because an average is philosophically incomplete.
The annual representation excludes event-count dynamics
The model does not estimate repeated-event frequency, duration, recovery paths, discounted project returns or reserve adequacy. Its exact arithmetic remains conditional on the declared annual event and additive loss definitions.